You’ve seen them all over the interwebs. You run into them as you’re scrolling through your feed on Facebook, as you’re checking your Twitter updates, as you’re looking for remodeling ideas on Pinterest.
They’re infographics, and they’re everywhere. But more importantly for nonprofits: infographics (and other data visualization tools) are not a passing trend. It’s time you add them to your fundraising toolbox.
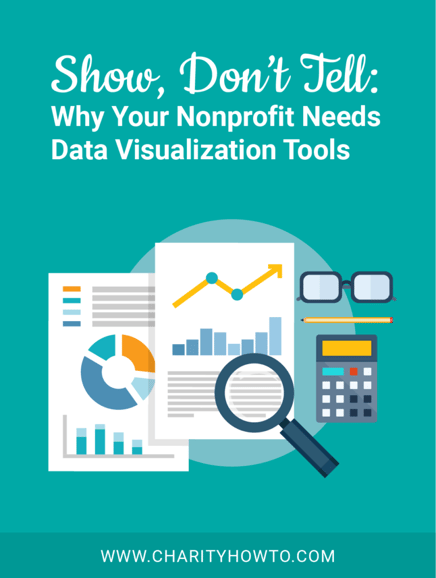
Infographics are graphic visual representations of information, data, or knowledge intended to present complex information quickly and clearly. Other data visualization tools—like charts, graphs, pictograms, gauges, dashboards, etc.—similarly present data in a pictorial or graphic format.
Why should you care?
Infographics and other data visualization tools:
- Combine appeals to logic and emotions (a critical element of getting and keeping donors)
- Engage 66% of all people who are visual learners
- Register much more quickly with readers than narrative: visual cues are processed 60,000 times faster in the brain than text
- Are visually intriguing and motivational
- Give the reader’s eye a place to rest (especially when incorporated with appropriate amounts of white space)
- Improve document readability
- Can be published and packaged in multiple ways, making it a multipurpose tool
That last bullet point may be the most critical: data visualization tools can be used anywhere—social media, websites, cases for support, annual reports, and even grant proposals.
So, how do you create infographics and other tools?
As a nonprofit pro, my default response is use something free! And there are some high-quality, free tools available, like Easel.ly, Canva, Infogr.am, Design Wizard, and Piktochart. I’ve used them all, and they’re intuitive, provide lots of layouts and options (even at the free level), and are user-friendly for those of us who don’t have graphic design backgrounds.
If you have the resources to hire a professional graphic designer or illustrator, do it. They are amazing professionals who can help you step up your game in developing compelling fundraising collateral. And you may be surprised to find a graphic designer in your area who specializes in nonprofit work – I know I was! They’re out there, and some of them are even willing to volunteer.
Looking for more info on how to make data visualization tools work for you?
Check out all our free and premium webinars on dashboards and reporting.
If you can’t make the live event, no worries. You’ll still receive the recording and all of our bonus materials in your inbox. Register now!