
Welcome!
Evaluating the effectiveness of an organization’s fundraising program may, quite simply, be one of the most overlooked tasks in fundraising 101. But, it is extremely important in order to improve your development efforts and, thereby, the long-term health of your development program.
There are common measurement tools and fundraising training resources available for the nonprofit industry. If this evaluation process is completed and the tools are utilized correctly, it can help transform your funding program. The end result will be a greater focus on your development efforts and higher returns.
This resource emphasizes the importance of fundraising cost-effectiveness by fundraising segment, provides clear direction on where to start, and outlines the detailed process for how to properly measure your effectiveness.
01 | UNDERSTANDING THE IMPORTANCE OF FUNDRAISING COST-EFFECTIVENESS
In order to get buy-in across the organization so all parties are vested, it is crucial to recognize and understand why it is so important for the fundraising process to be cost-effective. Nonprofits have to answer to the public. Appreciating this fact and gaining the knowledge to measure your effectiveness, as well as how to compare your organization to the industry, will mean understanding the implications for all of this on your fundraising process.
There are expectations on an organization to manage its funds efficiently. Donors want to know that their contributions are being used appropriately and wisely, thereby having an impact. They want their generosity to make a difference. Many studies show that prospects will give, and even increase their giving, if they have confirmation that their gifts are being managed properly. Also, it is believed that the decision to give is influenced by the reputation of an organization. In other words, the word of mouth from other donors, those being served, volunteers, etc. are a major influence.
Ensuring that the proper analysis is in place helps to provide security to donors and prospects in the form of measurable results and confidence in the organization’s ability to manage effectively. Therefore, measurement tools demonstrate a good investment of resources for your organization. And, in turn, the outcome provides evidence of a better return on the investment of your donors.
Be careful of the overhead myth though! There is a misconception that low fundraising costs mean that the organization is being managed efficiently and well. That is not necessarily true. The end goal is to have a vibrant and impactful development fund that is accomplished cost-effectively.
It is also helpful to understand where your organization stands in relation to the industry. While there are no national industry standards, there have been some studies of individual solicitation methods. It was concluded that each method performs at different levels of effectiveness and efficiency. For example, Donor Acquisition would be expected to perform differently than Retention. The same goes for Major Gifts vs. Annual Giving. So, these various solicitation methods should be treated accordingly with regard to evaluating results.
Studies found, though, that there is a general consensus as to what is a reason[1]able cost for fundraising activities. After three years of operation, bottom-line cost-benefit ratios for a mature fundraising development program should be as follows:
- Annual Fund - $.40 per $1 raised
- Major Gifts - $.20 per $1 raised
- Benefit events - $.50 per $1 raised
BE CAREFUL! There is a misconception that low fundraising costs mean that the organization is being managed efficiently and well. That is not necessarily true. The end goal is to have a vibrant and impactful development fund that is accomplished cost-effectively.
All nonprofits are not the same though, so it is not reasonable to expect the same fundraising abilities for your organization as for all others. Each nonprofit is unique with differences in mission and vision, history, the programs and services they offer, their donor base and level of reliance on private versus public monies, their people (leadership, staff, volunteers, etc.), their strategies, cost tracking methods, solicitation methods, or whether the organization is new to development or has an established, mature process.
It is imperative that you assess the priorities of your organization before starting this process. You’ll want to take a look at the culture and structure of your organization. Consider the nature of what you do. How do you currently manage the process of day-to-day operations, as well as evaluating your fundraising results? Do you have a process in place? What type of benchmarks do you use to compare any analysis, if this is completed. How involved is senior management in the process? Is the CFO preparing the fundraising budget? Is the Board involved? Specifically, consider what output analysis is being conducted, if any. (More to come below on specific analysis and tools – see the section on Developing Your Measurement Tools.) Finally, what type of reporting does your organization have in place to communicate results?
Consider the following:
- Mission, vision, present and future plans
- Relevancy and quality of programs and services
- Ability to manage operations and financial affairs
- Establish detailed reports on costs and results of EACH solicitation method
- Measure annual performance
- Compare performance across years
- Examine the amount of time expended and results achieved
02 | WHERE TO BEGIN?
A thorough calculation of your fundraising effectiveness begins with some critical, initial steps. It’s necessary to develop and establish certain key plans, budgets, and reports, and specific analysis must also be conducted. Finally, once established, the reports and processes must be reviewed periodically - annually, bi-annually, and monthly.
Initial Set-up (and annually, thereafter*):
- Conduct an internal audit of your fundraising development process.
- Determine the strengths and weaknesses of your current program.
- Review past results.
- Develop an annual fundraising plan (initial set-up*).
- Develop an annual budget (initial set-up*).
- Review and create a budget for each solicitation activity.
- Include direct, indirect, and overhead costs in each of these budgets.
- Develop a baseline (if it doesn’t already exist).
Review bi-annually:
Once established, review your development plan and budget on a bi-annual basis.
Review monthly:
Review certain, critical gift metrics on a monthly basis. These would include:
- Number of donors
- Solicitation activities and results (e.g., direct mail, membership, events, etc.)
- Gift income
- Purpose of gifts (e.g., unrestricted, temporarily restricted, and permanently restricted)
- Sources of gifts (e.g., trustees, corporations, etc.)
- Average gift size
Getting your organization set up for the process is the important first step in assessing the health of your program. It is vital that management, your staff, Board, volunteers, and all necessary parties are vested in this process.
03 | DEVELOPING YOUR MEASUREMENT TOOLS
So, you understand that costs should be managed well to be effective.
Metrics help to highlight opportunities for increased productivity and profitability. These calculated results can define performance and identify areas of improvement. Reviewing and analyzing these results can help an organization to then design a program that will help them to achieve unrealized potential.
There is also a need for nonprofits to justify their budgets for their fundraising profit center. This means proving efficiency and effectiveness. It also involves forecasting how much more money can be raised with investment into the program.
So, with this in mind, it is necessary to recognize the measurements that need to be assessed. But, remember! Comparative analysis between nonprofits is not fair. Therefore, performance measurements should be tailored to your nonprofit.
Before you begin determining the metrics that make sense for your organization, make sure you have a good handle on your expenses. Understand your financials. Know your expense categories. You’ll need these numbers before proceeding. The main expense categories are Direct Costs, Indirect Costs, and Overhead Costs. Some examples of these would include:
Direct Costs:
- Printing
- Postage
- Entertainment and Dining Fees
- Travel Expenses
- Telephone Expenses
- Office Equipment
- Donor Recognition
Indirect Costs:
- Staff Salaries and Benefits
- Administrative Support
- Technology Fees
- Employee Development
- Gift Processing
- Newsletters and Brochures
Overhead Costs:
- Utilities
- Insurance
- Mortgage or Rent
UNDERSTAND YOUR FINANCES: Before you begin determining the metrics that make sense for your organization, make sure you have a good handle on your expenses. Understand your financials. You’ll need these numbers before proceeding. The main expense categories are Direct Costs, Indirect Costs, and Overhead Costs.
You’ll want to be aware of the comprehensive list of metrics available, but then you’ll need to identify and develop the performance indicator tools relevant for your nonprofit. Performance metrics range from basic to more advanced measurements. Following is a high-level, complete listing of the metrics broken down into three main groups:
GROUP A: Basic units of measurements
- Mailed Pieces (#)
- Gifts Received (#)
- Event Participants (#)
- Gross Income Received ($)
- Campaign or Activity Expenses ($)
GROUP B: Common units of measurement
- Campaign Participation (%): (Calculation: # of Participants Invited/Total Solicitations)
- Donor Upgrades (%)
- Frequency of Donor Upgrades (%)
- Donors with Decreased Giving (#)
- Donors Giving Remained the Same (%)
- Board Participation (%)
- Volunteer Participation (%)
- Average Gift Size ($): (Calculation: Revenue/# of Participants)
- Multiple Gifts Annually (#)
- Net Income ($): (Calculation: Gross Income – Expenses)
- Average Cost Per Gift ($): (Calculation: Expenses/total # of Donor)
- Cost of Fundraising ($): [Calculation: Expenses/Revenue]
- Rate of Return (%): [Calculation: ((Net Income/Expenses)*100)]
GROUP C: Advanced units of measurement
- Donor Retention Rate (%)
- Rate of Transition (%): [Calculation: First-time Donor to Repeat/Regular Donor]
- Percent of Donors Who Increase Gift Size (%)
- Gift size ($)
- Cost Per Donor
- Donor Value ($)
- Lifetime Value (Long-term Donor Value) ($)
- Reactivation of Lapsed Donors (#)
- Online Gift Percentage (%)
- Email Conversion Rate (%)
- Email Opt-Out Rate (%)
- Social media conversions (%)
- Relationship Building and Satisfaction*
- Board Relationship Nurturing*
- Staff Performance*
- Average MAJOR Gift Size*
- Frequency of Donor Contact*
- Asks*
- Conversion Rate*
*See note below regarding Other Advanced Indicators
Now, the following defines and provides more explanation about the above units of data measurements.
GROUP A: Basic performance indicators
The “Basic” units of data measurement are:
- Mailed Pieces (#) = The number of mailed items sent to select database groups or the number of direct requests.
- Gifts Received (#) = The number of gifts received by mailing or the number of donors responding with gifts.
- Event Participants (#): The number of audience members in attendance.
- Gross Income Received ($): The amount of income received, excluding expenses or the value of gifts and contributions received.
- Campaign or Activity Expenses ($): The cost of expenses associated with fundraising mailing, including copywriting, design, mailing services, and postage or any other associated fundraising budget costs that were spent.
GROUP B: Common performance indicators
Units of data measurement used more commonly across nonprofits are:
- Campaign Participation (%) = The number of replies received as a percentage of all of those invited to participate.
- Donor Upgrades (%)
- Frequency of Donor Upgrades (%)
- Donors with Decreased Giving (#)
- Donors giving remained the same (%)
- Board Participation (%)
- Volunteer Participation (%)
- Average Gift Size ($): (Calculation: Revenue/# of Participants)
- Multiple Gifts Annually (#)
- Net Income ($): (Calculation: Gross Income – Expenses)
- Average Cost Per Gift ($): (Calculation: Expenses/Total # of Donors)
- Cost of Fundraising ($): The bottom-line measure of overall profitability and productivity (Calculation: Expenses/Revenue)
- Rate of Return (%): Direct relationship between investment and profit. [Calculation: ((Net Income/Expenses)*100)]
- Note: Aim for return to increase annually.
GROUP C: Advanced performance indicators
This group includes four major categories of indicators. These are: Donor Loyalty, Donor Acquisition, Online Gifts and a catch-all category for all other advanced indicators – Other Advanced Indicators.
Donor Loyalty:
- Donor Retention Rate (%)
- Rate of Transition (%)
- Percent of Donors Who Increase Gift Size (%)
- Gift size ($)
Donor Acquisition:
- Cost Per Donor ($): The cost your development program pays to convince a donor prospect or nondonor to become a donor.
- Donor Value ($): The amount of money each of the individual donors in your database has donated to the organization.
- Lifetime Value (Long-term Donor Value) ($): The total net contribution a donor will give over his or her lifetime (i.e., how much a donor might be worth to the organization over time).
- Reactivation of Lapsed Donors (#): Donors who have given at least once in the past and give again after lapsing.
Online Gifts:
- Online Gift Percentage (%)
- Email Conversion Rate (%)
- Email Opt-Out Rate (%)
- Social media conversions (%)
Other advanced indicators*:
- Relationship Building and Satisfaction
- Board Relationship Nurturing
- Staff Performance
- Average MAJOR Gift Size: The average giving capacity in terms of dollars of top donors.
- Frequency of Donor Contact
- Asks: The number of asks made in a given period.
- Conversion Rate: This action could be many things, ranging from attending an event to responding to a direct mail letter.
*Some of these measurements are more ambiguous and have less defined calculations. Review and discussion would likely need to accompany the analysis of these factors.
SAMPLE APPEALS COMPARISON REPORT
This appeals summary explanation sheet is for the board and staff to determine the reasonable costs of the fund development activities as well as determine which methods are most cost-effective and efficient for the organization. This summary is a proven methodology for setting & evaluating performance standards and should be used in your nonprofit dashboard.
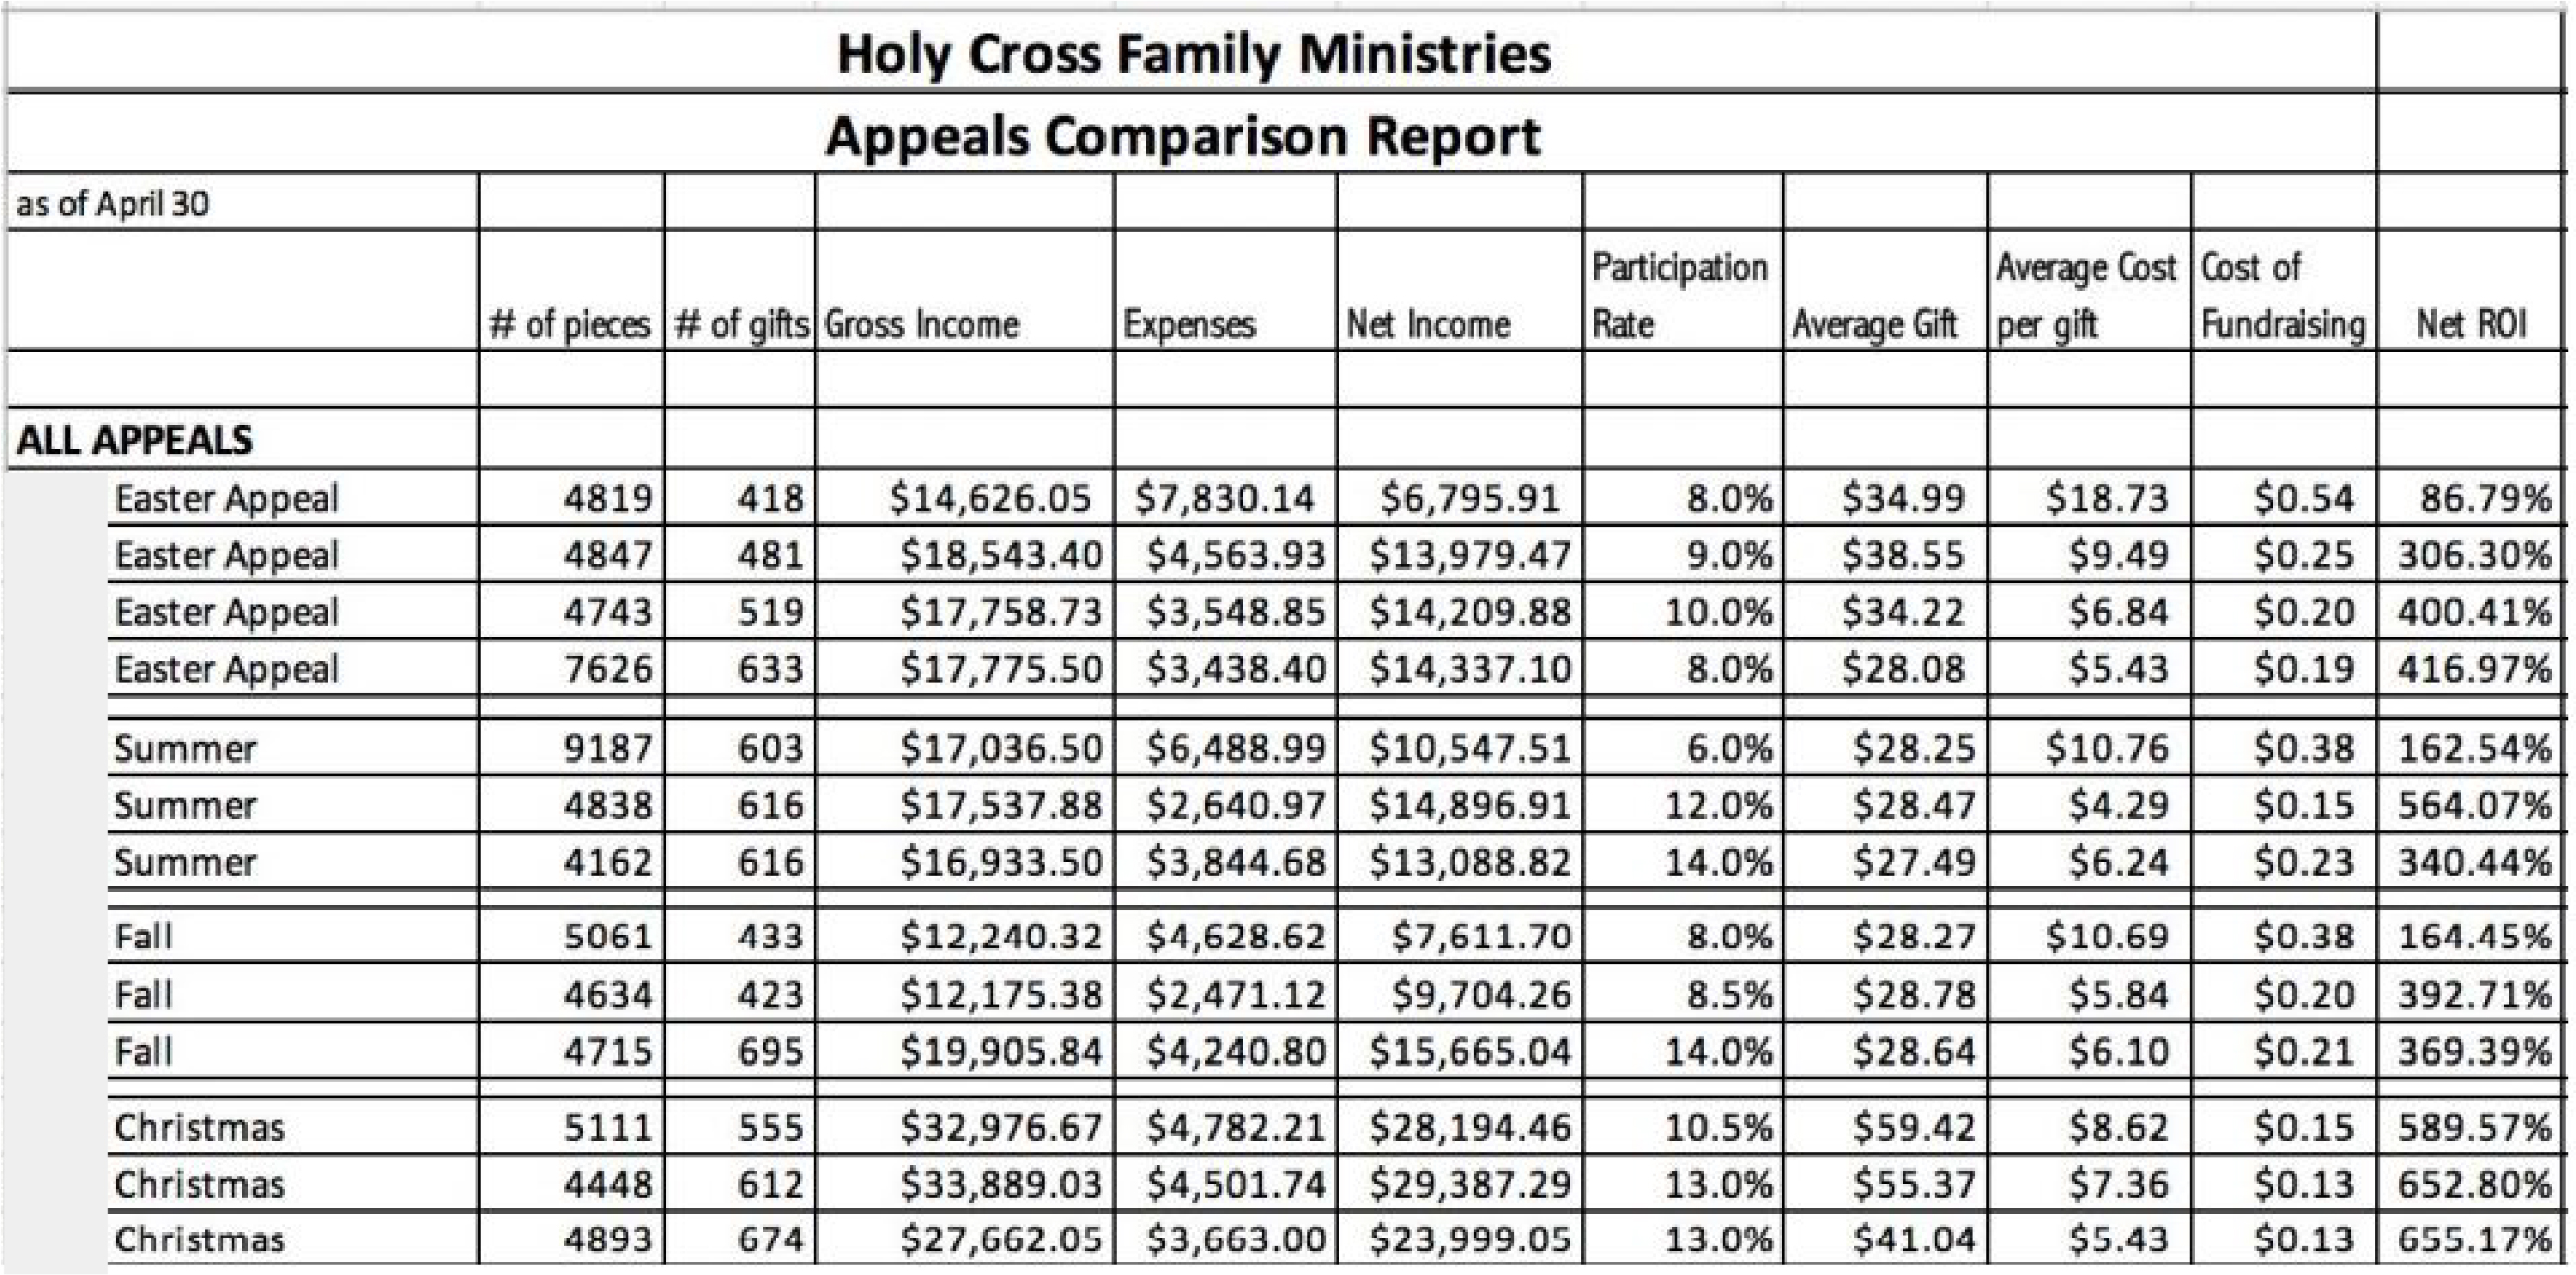
Chart Legend
- # of pieces - # of pieces mailed to select group of the database or number of direct requests # of gifts
- # of gifts received by mailing or number of donors responding with gifts
- Gross income – Income without expenses calculated or values of gifts and contributions received
- Expenses – mailing expenses including copywriting, design, postage or amount of fundraising budget spent
- Net income – Expenses minus gross income
- Participation rate – # of participants divided by total solicitations
- Average gift – Divide revenue received by participants
- Average cost per gift – Divide expenses by participants
- Cost of fundraising – Expenses divided by revenue
- Net ROI – Net income divided by expenses; multiplied by 100 for percentage rate of return
04 | ANALYZING STRATEGIES
Once you’ve determined your metrics and calculated the results, the next step is to analyze the data. At the same time, you are also analyzing the existing strategies of your organization and the solicitation activities that are conducted.
Reasonable cost guidelines for solicitation activity are*:
- Direct Mail (Acquisition): $1.25 to $1.50
- Direct Mail (Renewal): $0.20 to $0.25
- Special Events: $0.50
- Volunteer-led Personal Solicitation: $0.10 to $0.20
- Corporation and Foundation Grants: $0.20
- Capital Campaigns/Major Gifts: $0.20
- Planned Giving $0.20 to $0.30
*All costs are per $1.00 raised.
Excerpted from 'Budgeting for Fundraising and Evaluating Performance', 3rd Edition 2011 by James M. Greenfield.
Each component of the program should also be analyzed. If the reasonable cost guidelines are met, then consider the strategy a keeper. If NOT, then evaluate why. Don’t eliminate an activity solely on these guidelines, especially if you have other “goals” in mind for a particular strategy. But, recognize this during the planning process as you modify your plan.
The major components include the following:
- Annual Fund
- Membership
- Telephone
- Major Gifts
- Special Events
Individual analysis should consider…
Annual Fund
- What does an organization do with its newfound friends?
- Has there been an upgrading of donors through the investment of time and attention?
Membership
- How many prior members renewed? What percentage?
- What was the average membership gift amount?
- How many members increased or upgraded to a higher level?
- How many new members were recruited?
- How many new members were added to each membership level?
- What was the average gift amount of the new members?
- How many members failed to renew?
- What were the total costs of the membership drive and the cost of fundraising compared with dues received?
- What changes are needed for the next drive?
Telephone
- Compare telephone results with other Annual Giving performance.
- Determine which was more successful.
- Demonstrate a level of effective telephone contact for prior donor renewals/ upgrades.
- Compare the letter-call-letter sequence with a letter-only or phone-only method.
- Study results from prior donors and lapsed donors (where telephone often works best).
Major Gifts
- Analyze basic details
- Number of donors
- Gift amount
- Average gift size
- Gift upgrades
- How many donors were not visited?
- How many prospective donors did not give?
Special events
- Count the number of people attending.
- Determine who attended.
- Determine the effectiveness of each strategy and its execution.
- How many guests attended and then became donors?
It is also useful to analyze the entire program. Complete a collective analysis of the fund development program. Three years of data analysis is more telling than just one year. Longer-term comparisons, such as ten-year comparisons, provide substantial data. Results should be expected to increase year over year. You should see improvements in the cost of fundraising and the return percentages. Be sure to compare apples to apples, and figure in events such as large capital campaigns. Finally, analyze performance against budget projections.
05 | USING DATA FOR REVENUE FORECASTING
Adequate details are now available to predict results for each solicitation, especially if you have three or more years of data. So, you can now make investment decisions regarding how to best invest your fundraising budget. You’ll want to invest in programs with a high expected rate of return and net income that more than justify the decision to commit the same, or increased, budget resources to solicitation activities.
Where to invest?
Choose solicitation activities for which there is, has been or expects to be potential growth and where there is anticipated net income potential to be realized. Ideally, you’ll want activities that have proven strategic development in numbers of renewed and upgraded donors, acquisition long-term value, and where acquisition and retention go together. A strategy for which the organization considers the need a priority and there will be a pressure for cash is significant. Consider your people resources here as well. Solicitation activities for which there is/has been/expects to be an improving quality and personalization of your development office and for which the present staff has proven capable is beneficial.
There are certain variables, specific to your organization, that need to be taken into account as well. Consider the following questions:
- Does your organization have to change institutional priorities?
- Consider the participants - donors, volunteers, staff, etc. Do you expect any changes in the number of people working for your cause?
- Are there external conditions, such as the economic climate, that you anticipate possibly changing and that would be outside of your control?
- Does your organization face competition from related nonprofits that may impact its ability to fundraise?
All of these things will impact your strategic decisions.
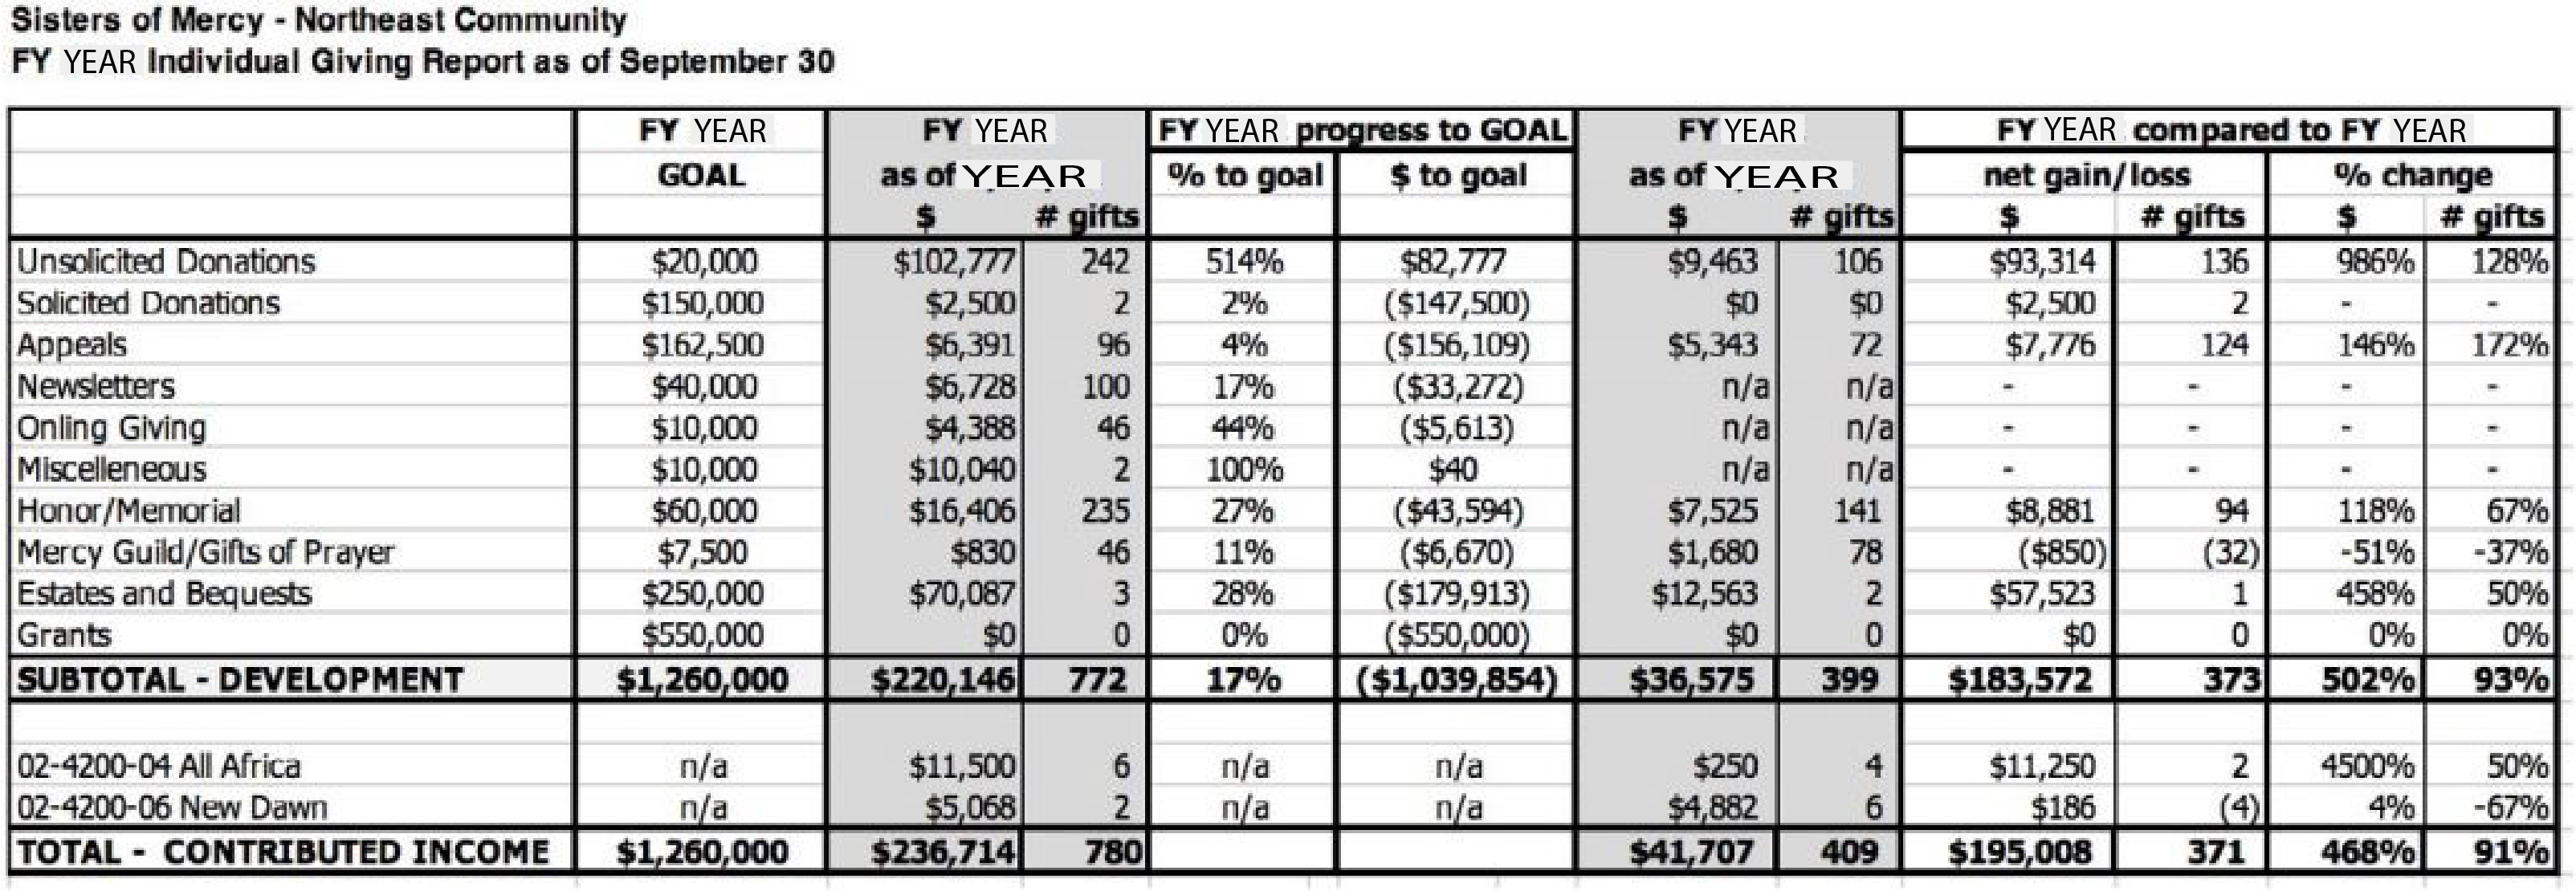
SAMPLE GIVING REPORT
06 | CONCLUSION
The above provides you with some concrete details on how to evaluate the health of your development program and calculate its effectiveness. Establishing a baseline, and then developing measurement tools, allows you to analyze strategy and predict revenue reliably. I hope that you will find this to be a valuable resource in getting started with this process. This is one of the most forgotten, yet extremely important, tasks in fundraising. Use the resources laid out here to leverage these tools to get started and ensure a successful and effective development program for your organization.
To learn more about fundraising metrics - or other nonprofit training courses - CLICK HERE and learn how to fundraise for a nonprofit the right way!